Table of Contents
Background Information
A good introduction on choropleth map can be found here.
This article will focus on the method to interact with Choropleth Map App. The goal of the app is to simplify choropleth map drawing by uploading a structured CSV file.
User can manually resize and download plots to use in presentation slides or any other medium of communication. Manual coloring will never be featured as the author believes that it is inherently difficult for human to map color with numbers. However, a personalized theme can be designed upon request. The app is a Shiny and R session powered with ggplot2 and sf package underneath. For greater flexibility, the author highly recommend users to adopt them.
Plot Parameter
Region
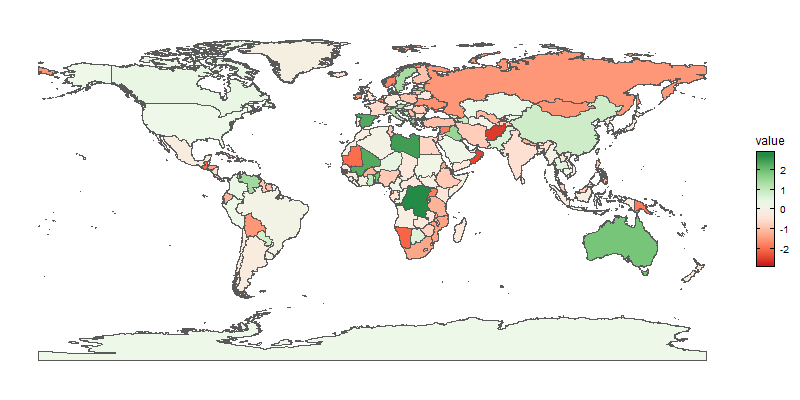
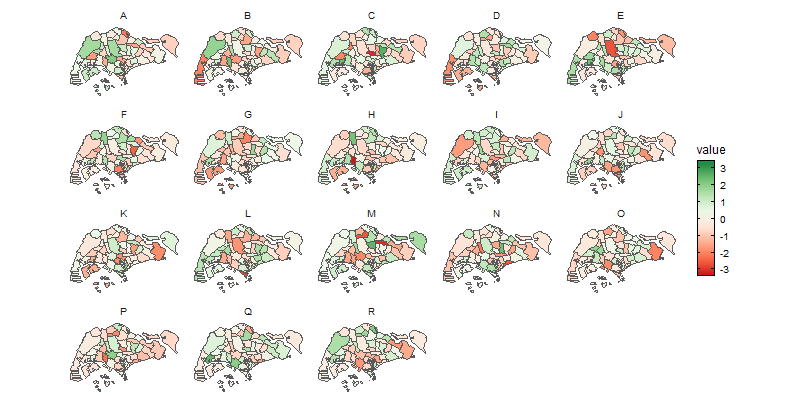
The area of interest. The app currently supports: world, and singapore only.
Division
The means on how a given Region is divided, which introduce the boundaries of each sub-region. The app currently supports: countries boundary for world, and Master Plan 2014 Planning Area boundary for Singapore only.
Theme
Design and the overall look of the plot. Additional theme can be introduced upon request,
(+)Color, (-)Color
Color scheme choices as specified in http://colorbrewer2.org. Color for regions with positive values can be picked in (+)Color, negative values in (-)Color.
Method
Standard
Basic choropleth map structure.
Facet
Selecting facet introduce another plot parameter
- Additional Category Level:
It enables comparison between multiple plots. The structure of the dataset required change.
Font Size (px)
The size of the font in the plot.
Upload CSV File
Upload CSV file when your dataset has the same structure with uploaded dataset. A CSV file has the same structure when it has the same column names and order as the sample dataset. Every division is also associated with some value (No missing division). Do not upload irrelevant file!
Dataset
The option on whether the plot drawn is derived from sample dataset or uploaded dataset.
Manual Size
The option on whether the plot size can be drawn manually maximizing the screen real estate.
If manual size is ticked, the plot re-draw automatically without pressing the RE-PLOT button.
Height (px)
The height of the graphical device.
Width (px)
The width of the graphical device.
Suggested Workflow
- Select the options on every plot parameter (pick the sample option for Dataset parameter).
- Press the RE-PLOT Button.
- Download sample dataset using Download CSV button.
- Using the tool of your choice (e.g., Micosoft Excel, Notepad) ensure your dataset has the same structure with downloaded dataset.
- Upload the new dataset.
- Select the upload option for Dataset parameter.
- Press the RE-PLOT Button.
- To download, right-click on the plot.